






What’s the Difference?
Orthogonal methods in practice: Understanding distinct detection principles and thresholds, sizing rules, and morphology-based particle characterization.
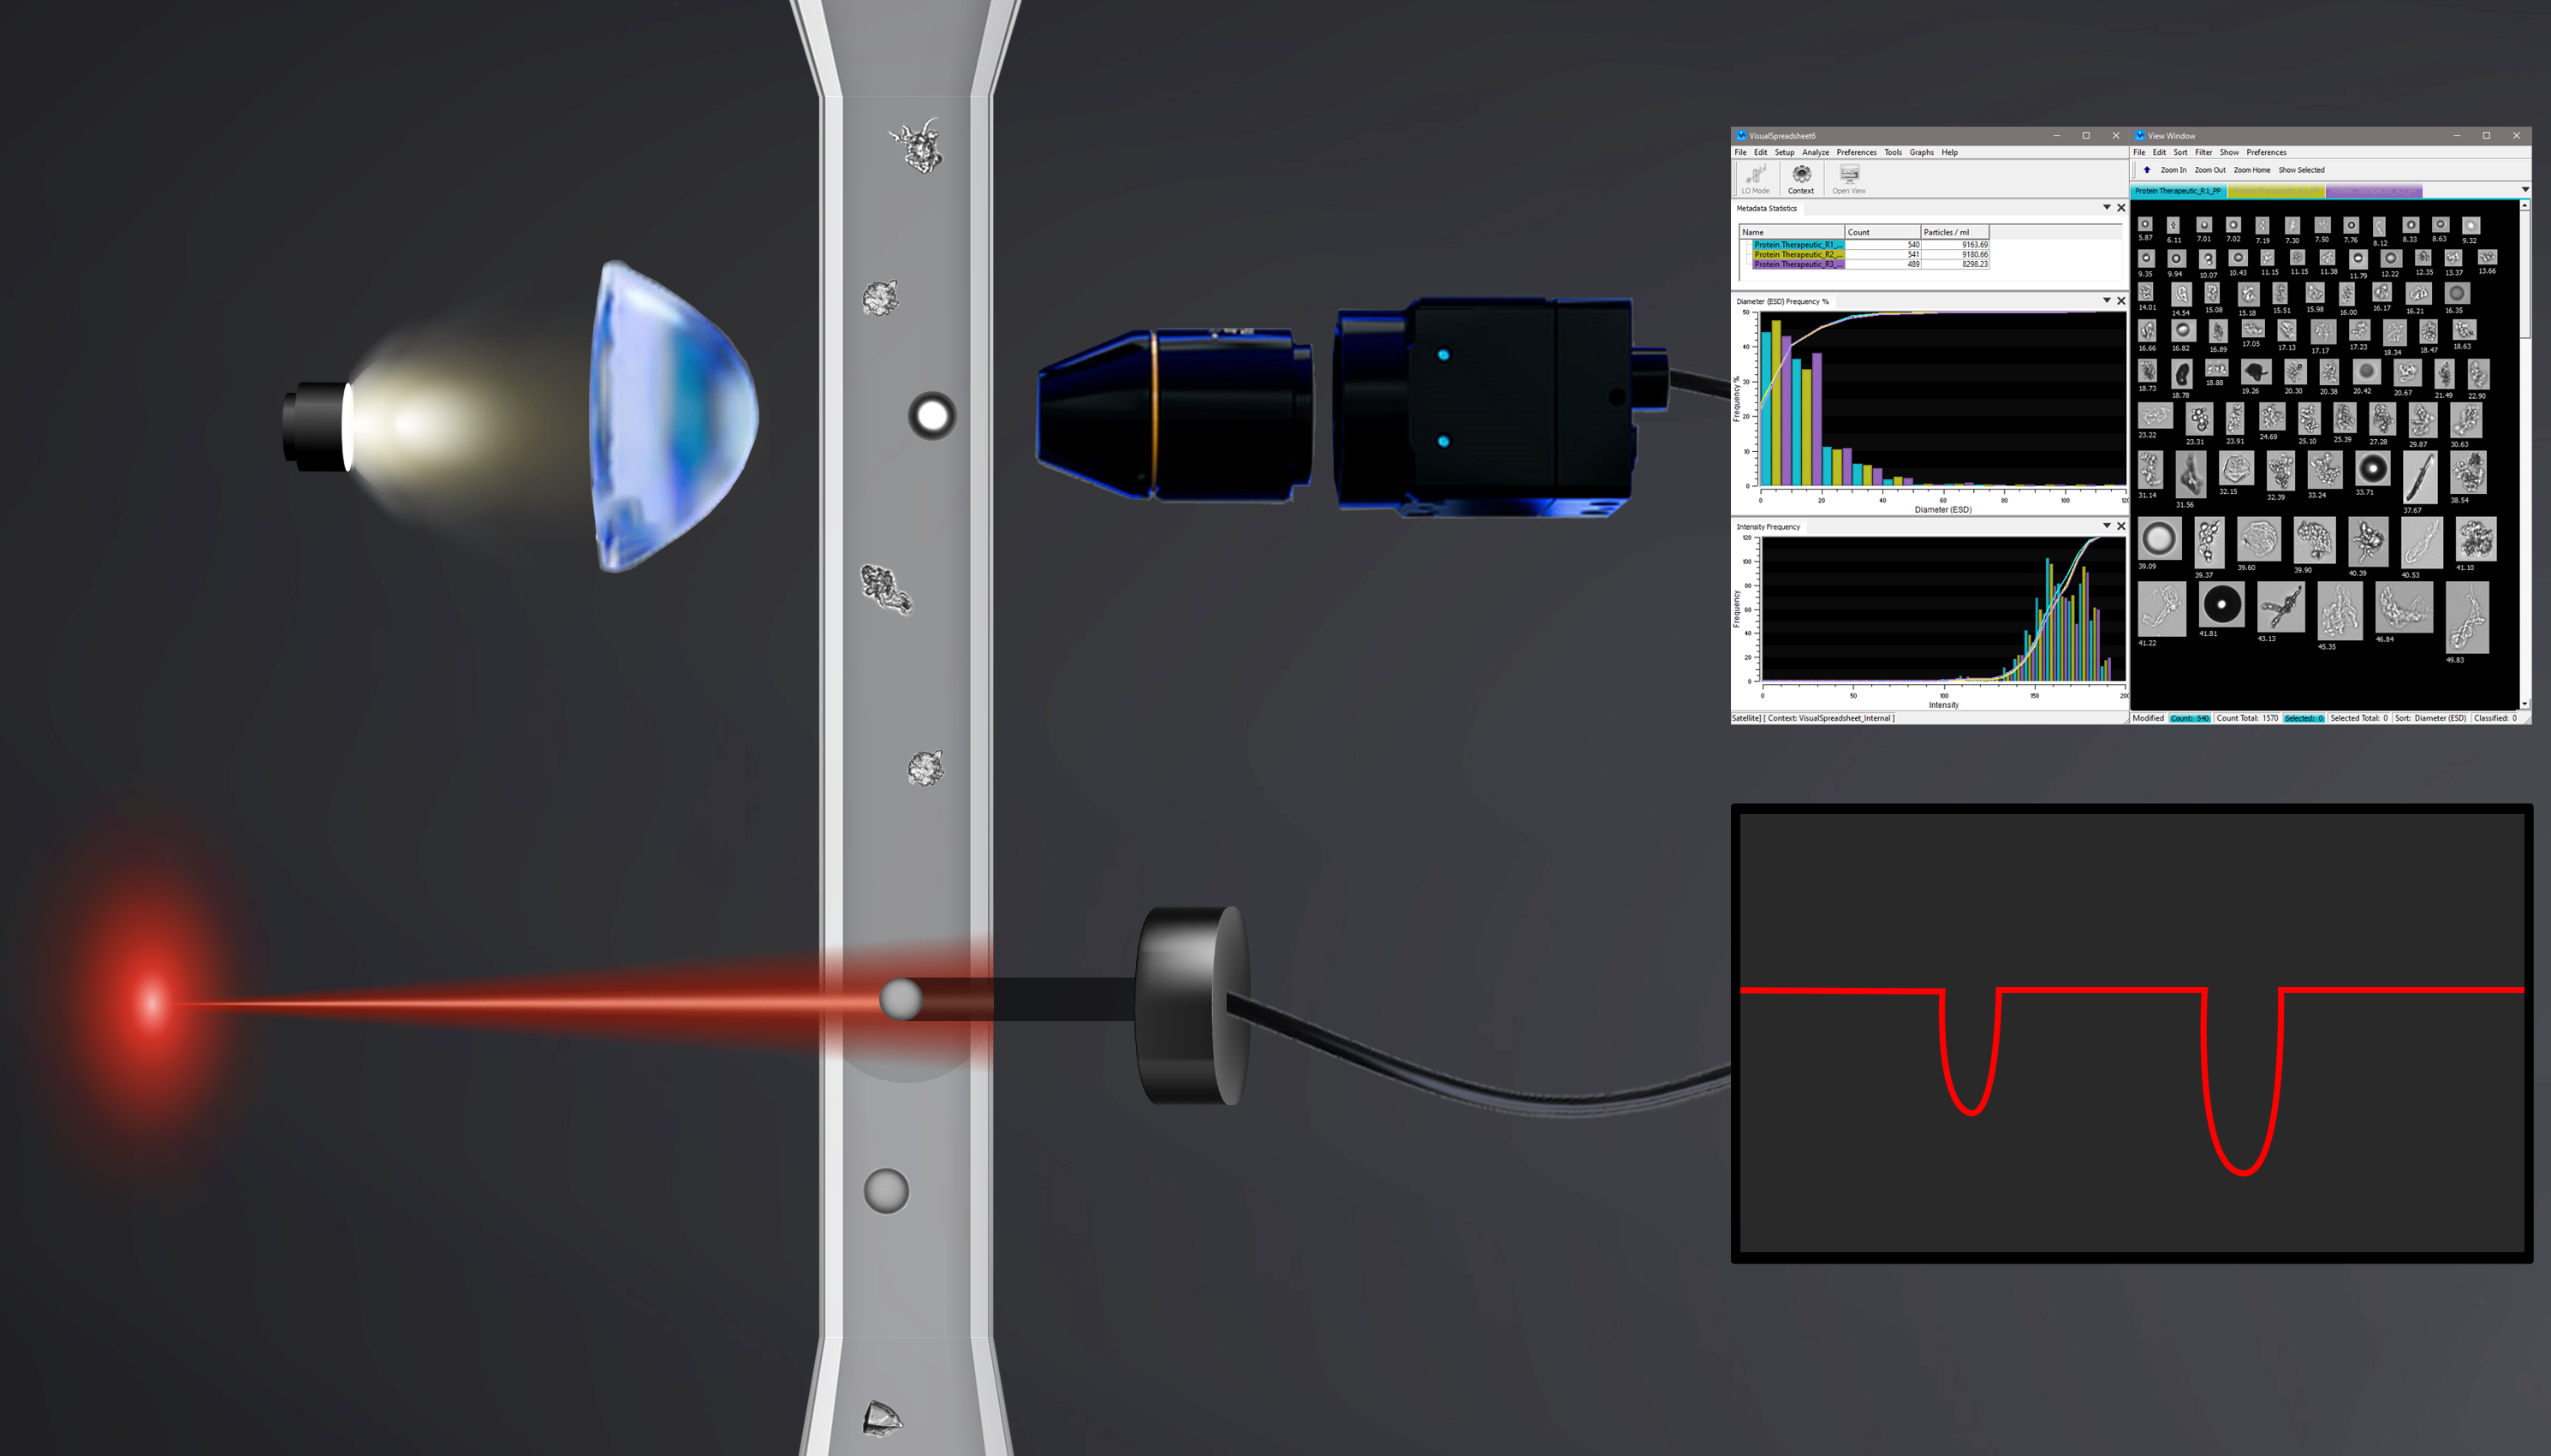
Light obscuration (LO) and flow imaging microscopy (FIM) particulate analysis methods often produce different results. These differences, however, are precisely why both methods are recommended for subvisible particle analysis. While alignment is expected when analyzing standard spherical particles, LO and FIM results for formulation-derived particles are not expected to be identical. The methods rely on fundamentally different detection principles, and any observed differences can provide valuable insight into how particles are behaving within a biologics formulation.
LO and FIM are orthogonal methods. LO provides the compendial particle counts used to evaluate a formulation against the ≥10 µm and ≥25 µm ESD limits established by USP <787>/<788> and the additional ≥50 µm ESD limits by USP <789> for ophthalmic solutions. FIM, as recognized by USP <1788>, provides particle images from which orthogonal ESD measurements are derived, as well as many other complementary morphological measurements that help characterize populations contributing to those counts.
Viewed together, these methods can turn agreement or divergence into diagnostic evidence. Consistent results can reinforce confidence in an observed trend, whereas method-specific differences can direct attention to particle attributes that warrant further investigation. Interpreting results in the context of each method’s detection and sizing principles helps distinguish formulation-related particle trends from method-dependent differences and supports a more informed assessment of product quality.
How Do Light Obscuration and Flow Imaging Microscopy Work?
Understanding how LO and FIM detect and size particles provides the framework for interpreting their results.
The table below summarizes the key differences in how each technology detects, sizes, and characterizes particles:
| Light Obscuration (LO) | Flow Imaging Microscopy (FIM) | |
|---|---|---|
| Detection principle | Measures the reduction in light intensity when a particle interferes with a beam of light focused on a sensor. | Captures digital images of particles moving through a flow cell. |
| Sizing method | Matches the light reduction pulse to a calibration curve built from known, spherical standards. Size reported as Equivalent Spherical Diameter (ESD). | Calculates size based on real digital images. Size reported as ESD, Filled Diameter (FD) and Area-Based Diameter (ABD); and several other sizes such as length and width. |
| Sensitivity to translucent particles | Low. Low-contrast particles, including protein aggregates, may be under-detected or undersized if they do not produce enough change in light intensity. | High. Captures spatial, pixel-level contrast within particle images and can detect and image translucent, low-contrast particles when acquisition settings are appropriate. |
| Particle characterization | Provides particle count and size distribution. Particle images or direct shape measurements are not available. | Provides particle count, size distribution, images, and morphological measurements including, but not limited to, aspect ratio, circularity, symmetry, and intensity. |
| Primary role / use case | Compendial particle counting for USP <787>/<788>/<789> testing and release assessment. | Image-based particle characterization, investigation of particle populations, root-cause analysis, and detection of low-contrast or morphologically distinct particles. |
Particle Detection Thresholds in Light Obscuration
LO detects a particle when its passage through the sensing zone produces sufficient change in transmitted light. The magnitude of that signal is compared with a calibration curve to assign an equivalent particle size.
Three types of thresholds are particularly important:
- Physical detection threshold: This is the physical limit of what the optical system can detect and is sometimes described as the instrument's "blind spot." Standard compendial LO sensors may have lower detection capabilities in the low-micron range, although the specific limit depends on the sensor, instrument configuration, and a particle's optical properties. Below the physical detection limit, the signal produced by a particle cannot be reliably distinguished from background noise.
- Signal and calibration threshold: LO instruments do not directly measure particle dimensions in micrometers (µm). They measure a change in transmitted light, which is converted into an equivalent particle size using a calibration curve generated from spherical particles of known size. NIST-traceable polystyrene spheres at defined sizes may be used to establish this relationship between the optical signal and equivalent particle diameter.
- Regulatory/reporting threshold: While LO systems can detect and monitor smaller subvisible particles for characterization purposes, official regulatory compliance and reporting requirements do not mandate limits for these smaller ranges. Instead, they prioritize the quantified counts at the ≥10 µm and ≥25 µm (and ≥50 µm for USP <789>) thresholds to ensure product safety and quality.
The LO calibration assumption: It is important to keep in mind that while LO systems are calibrated using perfect spheres, real-world particles have irregular shapes and optical properties, meaning they will not respond to the system in the same way as calibration spheres.
Particle Detection Thresholds in Flow Imaging Microscopy
FIM detects particles based on contrast with the surrounding background. Once the particle has been segmented from the full camera image, its dimensions and morphological properties are calculated from its pixel-defined boundaries.
As with LO, several thresholds influence what is detected and ultimately reported with FIM:
- Optical resolution limit: An FIM instrument’s optical resolution limit is the minimum physical distance between two distinct points that is required for the lens to still see them as separate points. It is strictly dictated by the physics of light diffraction, particle position relative to the focal plane, and optical aberration, meaning no amount of digital magnification or pixel shrinkage can reveal details smaller than this threshold. Thus, reliable FIM size and shape measurements for in-focus particles require sufficient optical resolution and quantity of pixels to represent the particle.
- Contrast threshold: FIM systems distinguish particles from the image background based on differences in pixel intensity. These intensity differences arise when a particle modifies the transmitted optical field through attenuation/absorption, scattering, refraction, diffraction, and/or changes in optical path length. Propagation through the imaging system converts these changes into measurable intensity variations that take the form of visual contrast. Adequate contrast is required for reliable particle detection and segmentation. Pixels that meet the user-defined dark and light intensity threshold criteria are segmented, and adjacent segmented pixels are grouped to establish the particle boundary used for subsequent measurements.
- Morphology and sizing threshold: Once a particle image has been segmented, geometric measurements can be calculated from its image. The software can evaluate particle area, maximum dimensions, width, shape, or other properties. Minimum and maximum size criteria can subsequently be applied to select which detected particles are included in the reported data.
The FIM acquisition-setting requirement: Because segmentation defines which pixels belong to a particle, appropriate imaging and acquisition settings are particularly important when analyzing translucent and other low-contrast particle populations.
How is Particle Size Defined by LO and FIM?
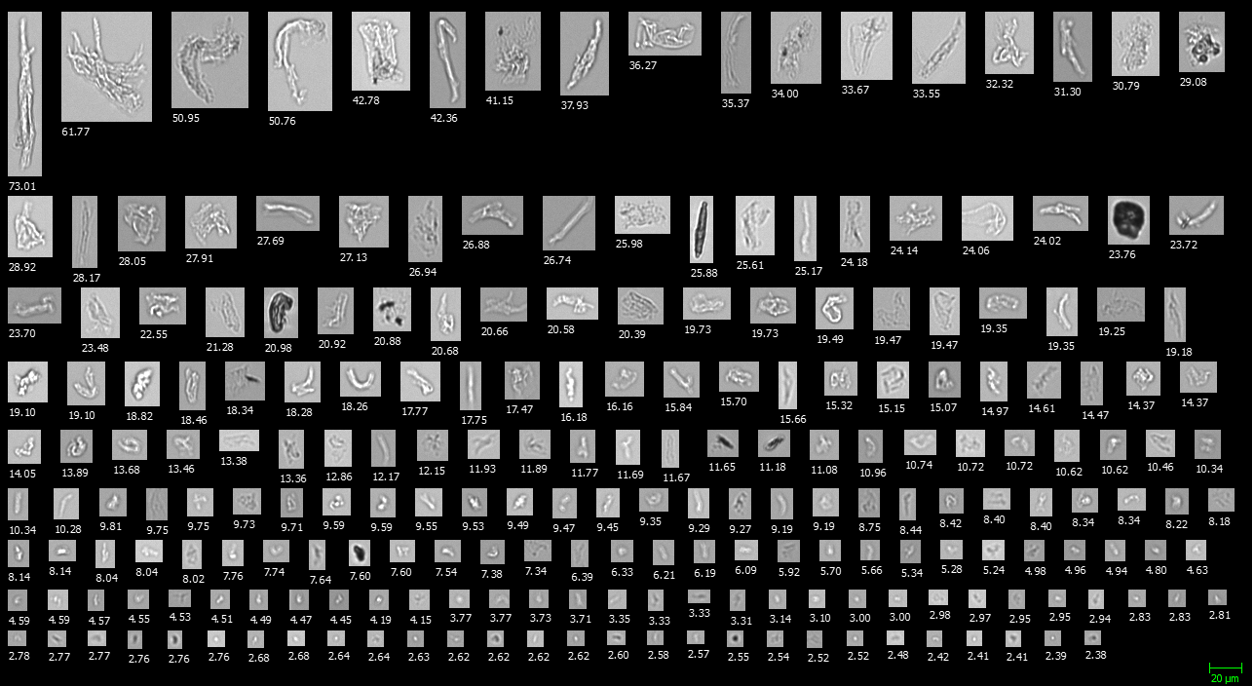
A particle does not have a single universally measured "size." For subvisible particulate testing of injections and ophthalmic solutions, LO is the compendial method, and equivalent spherical diameter (ESD) is the required reported metric. Because particle size is derived from the optical response relative to calibration spheres, LO-based ESD measurements may be misleading for translucent, nonspherical particles. Protein aggregates, for example, may allow more light to pass through than an opaque calibration particle of similar physical dimensions when the protein aggregates’ refractive index approaches that of the surrounding solution. The aggregate may then produce a signal corresponding to a smaller ESD. FIM is highly sensitive to contrast differences between particles and the background, enabling high-resolution images of translucent particles to be captured, from which ESD measurements and other morphological properties (such as circularity, aspect ratio, intensity, and transparency) can be calculated. Thus, FIM measurements offer insights into nonspherical and translucent particles that LO alone cannot provide because it reports only ESD.
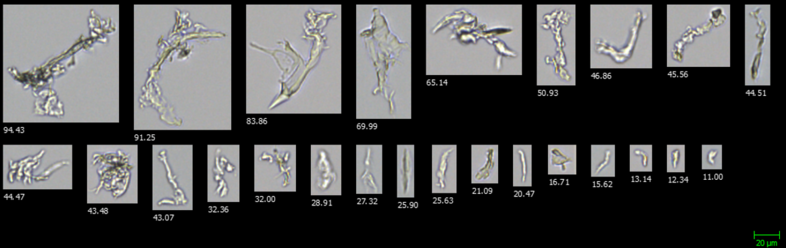
Property shown: Diameter (ESD) (µm)
Pictured Above: Select FIM images of ETFE (irregular shaped translucent protein surrogate) sorted by decreasing size by Diameter (ESD) (µm).
How Can LO and FIM Data Be Used Together?
LO and FIM can be used together by aligning relevant sizing metrics and reporting thresholds, then interpreting the results according to each method’s measurement principle. LO provides compendial particle counts, while FIM adds particle images and morphological data that can confirm observed trends or help explain differences between the methods.
There is a strong regulatory and technical rationale for using both LO and FIM data when evaluating particulate matter in biologics formulations.
When a sample produces similar particle concentrations or trends with LO and FIM under appropriately aligned conditions, agreement between the methods can increase confidence in the observed particle population. Conversely, divergence between measurements can prompt investigation into characteristics such as transparency, morphology, composition, or differences in how particle size has been defined.
This becomes particularly valuable during an out-of-specification (OOS) investigation.
If a product produces an OOS particle count during routine LO testing, FIM can provide additional evidence to help investigate the underlying particle population. To facilitate comparison with LO, FIM data can be evaluated using ESD and the same ≥10 µm and ≥25 µm thresholds used for the compendial assessment.
If corresponding trends or particle populations are observed, the FIM images can then provide information that is unavailable from the LO count alone. Particle images may be analyzed, sorted, and classified based on morphology to help distinguish populations such as air bubbles, silicone oil droplets, and protein aggregates.
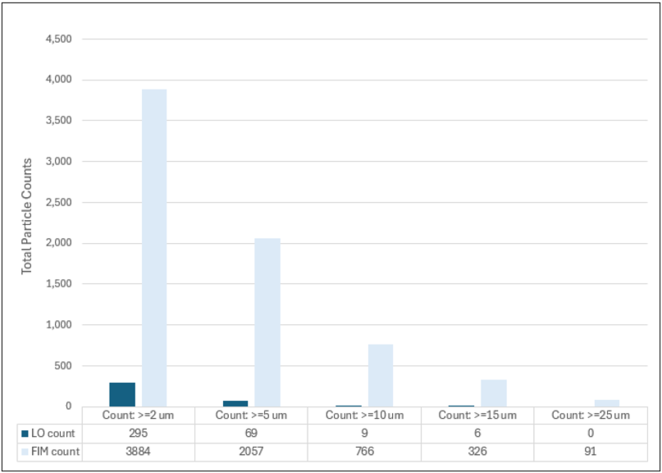
Pictured Above: While the decreasing trend in particle count with increasing size bins holds true between LO and FIM, FIM captures much higher total particle counts than LO.
Pictured Above: Differences in count between LO and FIM (using ESD as the sizing metric) can be explained with images. Top: Histogram depiction of FIM and LO particle count data on the same sample. Bottom: Representative images of particles from >2 µm to >25 µm ESD reveal the abundance of highly translucent protein aggregates in the sample to be the reason for the low counts observed with LO. Property shown: Diameter (ESD) (µm)
Using FIM Images to Interpret LO Results
The defining advantage of FIM as an orthogonal particle analysis strategy is that each detected event can be connected to a particle image and a set of morphological measurements. This supplements LO size and count data with valuable information about particle identity:
FIM images transform anonymous numerical data into visual evidence that can help investigators determine which particle populations are contributing to an observed count or trend.
Morphological parameters such as aspect ratio, circularity, symmetry, intensity, length, width, and other image-derived measurements can be used individually or in combination to distinguish populations with different physical characteristics.
This capability is particularly useful when particle populations overlap in size but differ in shape or optical properties. Protein aggregates and silicone oil droplets, for example, may occupy similar size ranges while exhibiting different morphology.
Using FIM alongside routine LO measurements can also provide additional information about low-contrast particles that may produce a relatively weak LO response.
Applying LO and FIM to Protein Aggregates and Silicone Oil Droplets
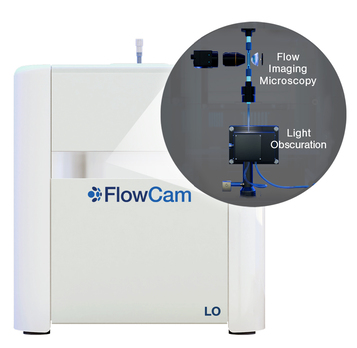 In a recent application note, our team used FlowCam LO, an instrument that produces simultaneous FIM and LO results, to demonstrate the additional information offered by image-based particle characterization. Model antibody-based biologic suspensions loaded into spray-on siliconized syringes were used in an accelerated stress test to evaluate FlowCam LO's ability to discriminate between human IgG aggregates and silicone oil droplets.
FlowCam FIM images revealed clear morphological differences between the two low-contrast particle populations, allowing aggregates and droplets to be separated using statistical filters based on particle shape.
Because each detected particle was linked to an image and a set of morphological measurements, the USP-relevant ≥10 µm and ≥25 µm populations could be further characterized according to particle morphology, including non-round protein aggregates and round silicone oil droplets.
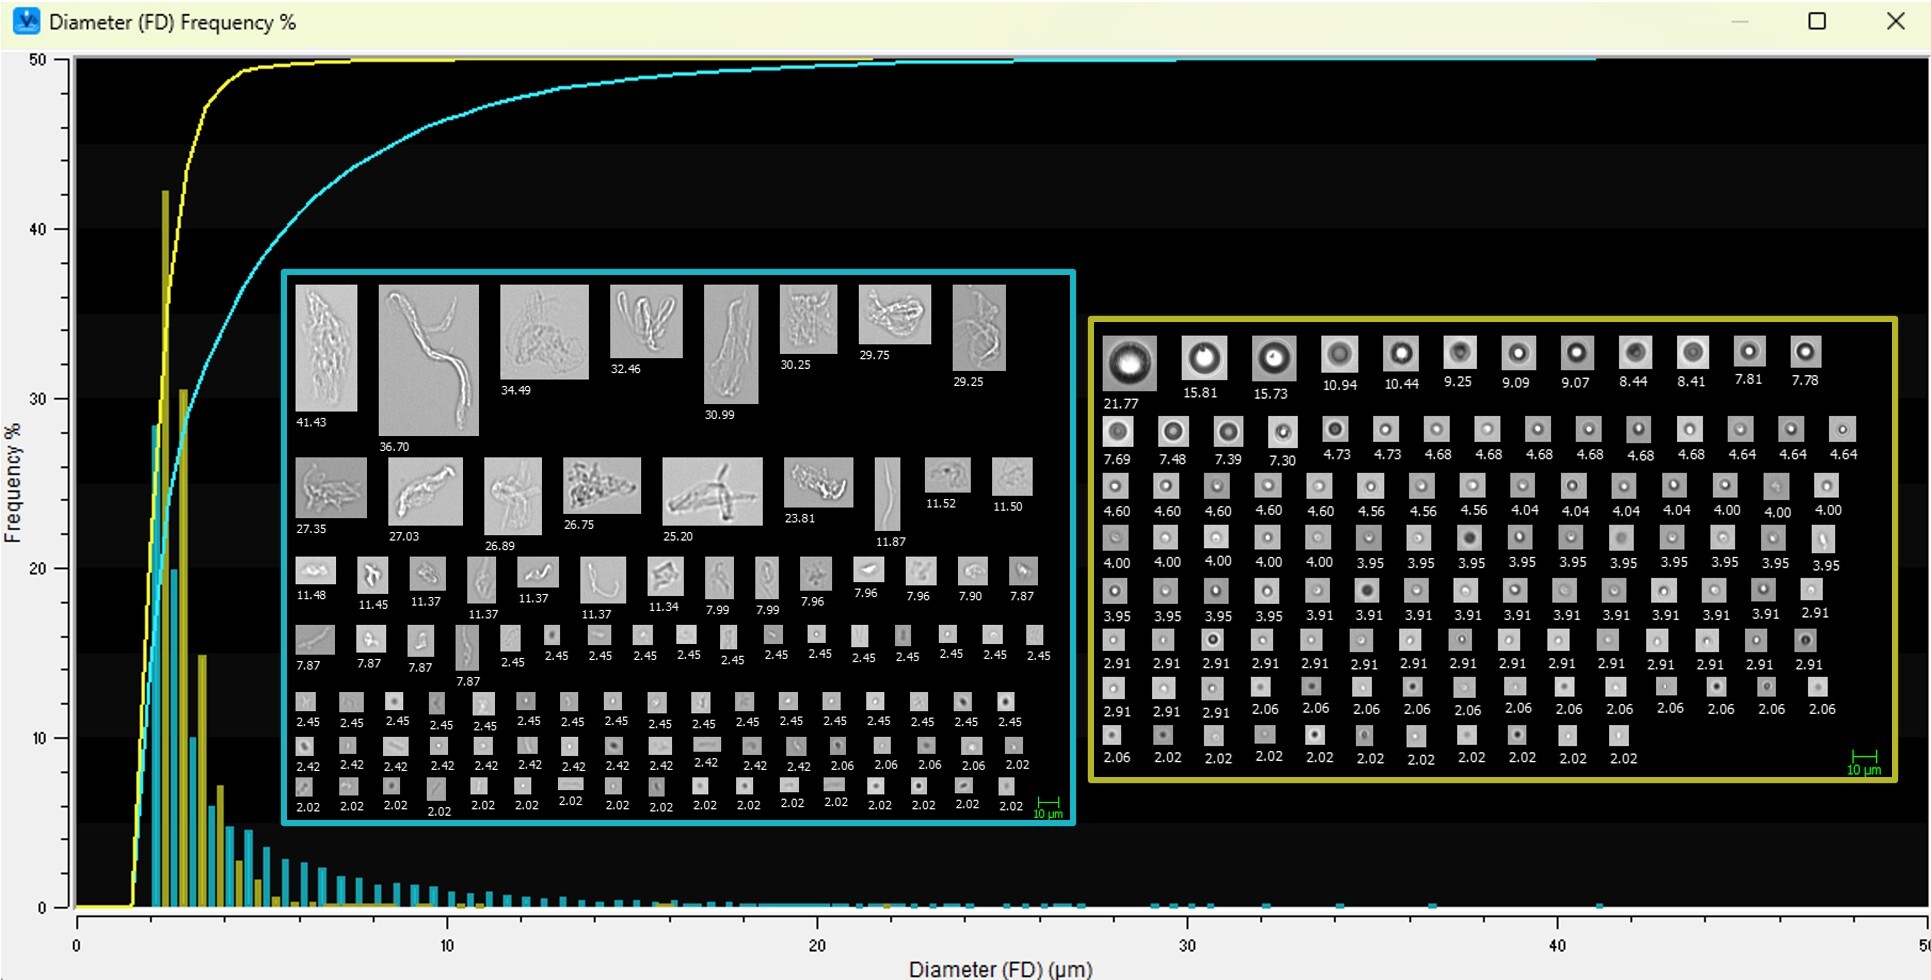 Pictured Above: Particle size distribution and representative image collages of hIgG proteinaceous aggregates and flick-generated silicone oil particles (SiOPs). Protein aggregates trend larger than SiOPs with the highest frequency for both in the 2-5 μm range. Inset: Representative images of SiOPs and protein aggregates show distinct shape and morphological differences.
While particle concentration trends were similar, tandem LO measurements on FlowCam LO showed lower absolute counts than the FIM data, consistent with the methods’ differences in the detection of highly translucent particles.
The Future of Flow Imaging Microscopy Standardization in Biopharmaceutical Quality Control Systems
Looking ahead, the elevation of FIM from an orthogonal characterization tool to a fully standardized compendial method for biopharmaceutical quality control hinges on cross-industry harmonization. As regulatory agencies increasingly demand deeper morphological characterization of subvisible particles, the future of FIM relies on the global adoption of unified data normalization frameworks.
Furthermore, integrating validated machine learning models and classification algorithms into 21 CFR Part 11-compliant software architectures will allow for standardized, high-throughput filtering of exogenous particles like silicone oil droplets. Once these normalization and digital validation hurdles are cleared, FIM is poised to establish a new compendial baseline, offering a more precise, reliable, and enforceable standard for biologics safety and quality assurance than traditional light obscuration.
Choosing a Subvisible Particle Analysis Strategy: Why Use LO and FIM Together?
Used together as orthogonal methods, LO and FIM provide complementary evidence about the same sample. LO establishes particle concentration at the compendial thresholds used for USP <787>/<788> assessment. FIM adds image-based evidence that can help determine why counts differ, characterize low-contrast populations, distinguish morphologically different particles, and investigate unexpected results.
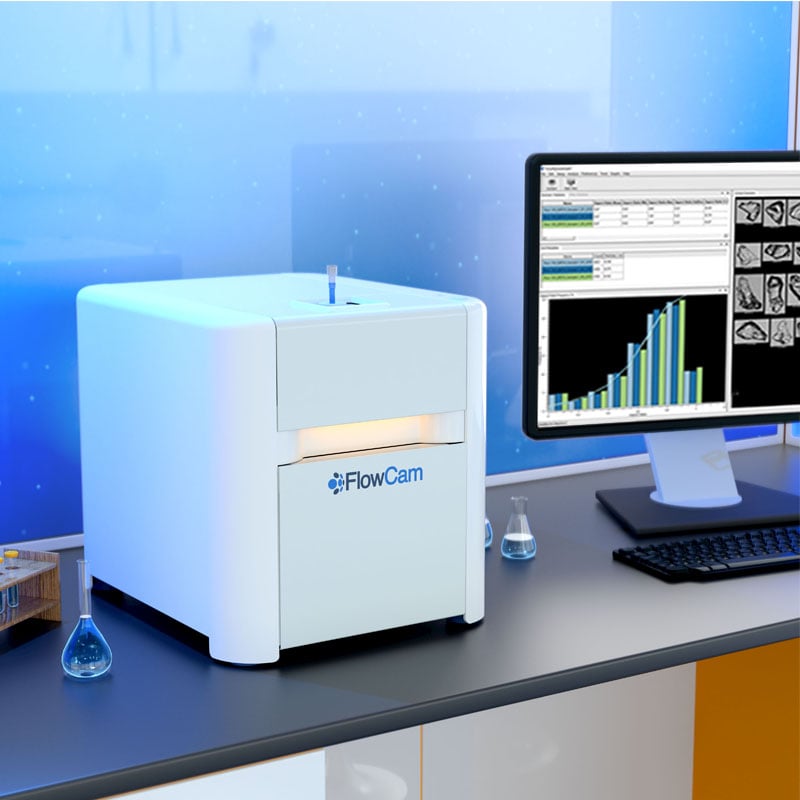
With its integrated dual-technology platform, FlowCam LO is positioned to support this combined approach. By combining light obscuration and flow imaging microscopy into a single fluidic path, the system allows laboratories to bridge established compendial LO data with advanced morphological analysis.
FlowCam LO’s operating software offers 21 CFR Part 11 compliance, including secure audit trails, electronic signatures, and multi-tier user permissions, supporting data integrity in regulated environments. Classification tools can also be used to differentiate and sort distinct particle populations, such as protein aggregates and silicone oil droplets, according to their image-derived characteristics.
Rather than replacing one particle measurement with another, combining LO and FIM provides two complementary views of the sample: compendial particle counting and image-based particle characterization. Together, those measurements can provide laboratories with greater analytical context for evaluating subvisible particles in biologic formulations.