

 Exploring Micro-worlds with FlowCam
As FlowCam’s Field Application Scientist with a background in plankton ecology and a passion for exploring remote landscapes, I spend much of my time at the intersection of science and the outdoors. In A Hiker’s Guide to the Planktoverse, I combine two things I love: hiking across the UK (and occasionally beyond) and investigating the hidden world of plankton and microbial ecology using FlowCam imaging and analysis. From roadside ditches to remote mountain tarns, every puddle or pond offers a glimpse into the dynamic microbial communities just beneath the surface.
Peaty Puddles of the Uplands: Microbial Life in Freshwater Bogs
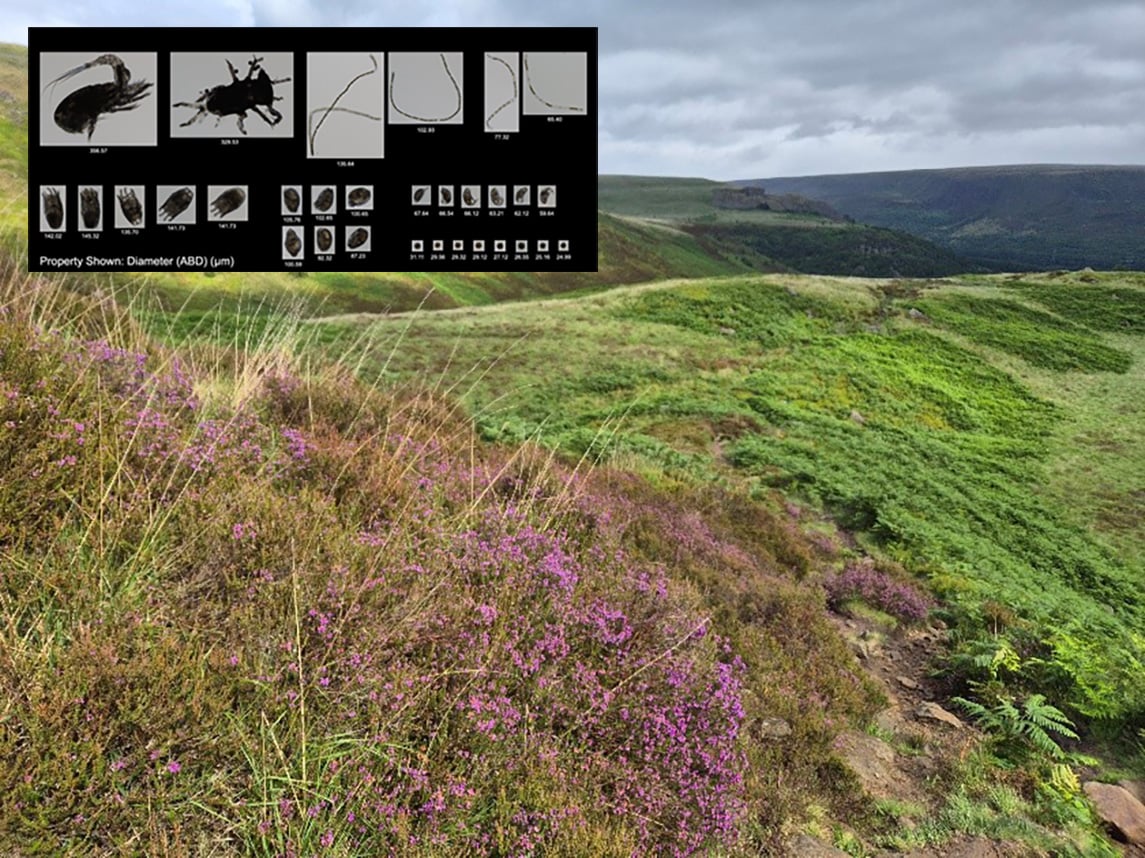
The upland moors of northern England (pictured above) are characterized by exposed peatland, acidic bogs, and shallow tarns formed in natural hollows. These environments, such as those found in the UK's Peak District National Park, are ecologically important environments, supporting hardy vegetation such as heather, sphagnum mosses, and cotton grass. They are also home to unique planktonic communities adapted to cold, nutrient-poor, and often highly acidic waters.
During a recent hike, I aimed to sample a series of small upland tarns using my new plankton net. However, an extended dry spell this spring had left most of these water bodies completely desiccated. Instead, I collected several small-volume samples from nearby peat-stained puddles using sample tubes. Although limited in volume and depth, these puddles still offered an opportunity to examine the microbial diversity present in highland bog environments.
 📍 Location: Northern England Upland Bog, Peak District National Park
🌤️ Conditions: Warm and dry following an extended dry period (though true to form, rain arrived just in time for sampling)
🧪 Sample Type: Peaty puddles (surface collection using centrifuge tubes)
FlowCam Analysis: Imaging Freshwater Plankton Communities
 Samples were analyzed using FlowCam 8100, configured with a 4X objective and an FOV300 flow cell. This setup is optimized for imaging mid-sized plankton and particulates (10–300 µm), offering a strong balance between throughput and magnification. While morphological resolution decreases below ~50 µm, this configuration allows for efficient screening of both small plankton and larger detrital particles within a single run, providing a broad overview of the sample's composition. The samples were run live, though FlowCam can also analyze preserved material, depending on project needs.
For readers new to FlowCam:
FlowCam is an automated, image-based particle analysis instrument that captures high-resolution images of microscopic particles passing through a flow cell and simultaneously generates quantitative data such as size, shape, and concentration. This dual approach enables rapid analysis of thousands of particles in minutes—providing both imagery and numbers in real time.
Meet the Puddles: Comparing Plankton Diversity
Sample 1 – Peaty Puddle. A shallow, dark puddle collected from an exposed peatland surface. The water was stained reddish-brown with humic substances and contained no visible macroorganisms. FlowCam revealed a community dominated by very small particles (10–20 µm), most of which appeared as oval cells and delicate threads—likely a combination of microalgae, protists, and suspended organic debris.

- Concentration: 531 total particles, 807 particles/mL
- Mean Diameter (ABD): 16.2 µm
- Dominant Organisms: Small oval cells and thread-like forms
- Context: Shallow, tannin-rich puddle from rain-fed peatland
Sample 2 – Macrophyte-Covered Puddle. This clearer puddle had submerged vegetation and a visible mat of macrophytes. FlowCam imaging revealed a greater diversity of shapes and sizes compared to Sample 1, including long filaments and relatively large invertebrates such as microcrustaceans. Despite the presence of larger taxa, most particles were again in the 10–20 µm range, suggesting a dense microbial background.

- Concentration: 3519 total particles, 1252 particles/mL
- Mean Diameter (ABD): 22.6 µm
- Dominant Organisms: Microcrustaceans, cyanobacteria & green algae, desmids
- Context: Deeper, clearer water with mat of macrophytes
Sample 3 – Shallow Grassy Bog. This sample came from a boggy depression surrounded by coarse grass. FlowCam revealed a community structure different again from the first two puddles, including several large organisms such as copepod nauplii and aquatic insect larvae. These were accompanied by a range of filamentous algae and colonial green algae, contributing to the highest mean particle size observed in this set.

- Concentration: 2117 total particles, 617 particles/mL
- Mean Diameter (ABD): 28.1 µm
- Dominant Organisms: Copepods, insect larvae, filamentous green algae & cyanobacteria, green algae colonies
- Context: Shallow, grass-fringed bog
FlowCam Insights: Quantifying Microbial Ecology in Plankton Samples
The three puddles revealed remarkably distinct communities, both visually and quantitatively. Shown below are selected organisms imaged with the FlowCam, including small flagellates, filamentous cyanobacteria, green algae, and a variety of larger microinvertebrates such as Daphnia, copepods, and insect larvae. While the diversity is immediately visible, FlowCam also captures detailed morphometric data that helps quantify how size, shape, and structure vary between sites.
 Representative organisms found in each puddle, visualized with FlowCam (4X Objective)
Sample 1: Small flagellates and simple filaments (likely cyanobacteria or green algae)
Sample 2: Daphnia spp., filamentous cyanobacteria & green algae, desmids
Sample 3: Copepod nauplius, aquatic insect larva, rotifers, filamentous cyanobacteria & green algae, Coelastrum colonies
The three puddles differed not only in the organisms visible in the collages above but also in their particle-size structure and shape diversity. The graphs below compare key metrics generated automatically by FlowCam: size distribution, aspect-ratio patterns, and circularity profiles. Together they illustrate how a single run can quantify thousands of particles and highlight community differences that are not obvious in the field.
The metrics below support the visual trends observed in the collages. Sample 1’s narrow particle-size range and high circularity suggest a relatively simple community, potentially indicative of low nutrient input or transient surface water conditions. Sample 2 shows a broader and bimodal size distribution, with both small microbes and larger microcrustaceans, which may reflect more stable or nutrient-rich conditions. Sample 3 features a moderate particle count but the greatest diversity in shape and size, driven by copepod nauplii, aquatic insect larvae, and a range of filamentous organisms.
 Size and shape metrics for the three samples. The size distribution plot (left) shows that all puddles are dominated by organisms in the 10–20 µm range; however, Samples 2 and 3 contain a substantial number of larger particles (100–300 µm). The circularity distribution (middle) reveals that rounder particles are more prevalent in Sample 1. Lastly, the aspect ratio vs. diameter plot (right) highlights a distinct group of large (~200–300 µm, circled in red), relatively round particles in Sample 2. Highlighting this cluster in VisualSpreadsheet identified them as Daphnia larvae.
While ecological interpretation remains tentative without supporting environmental data, FlowCam enabled rapid, quantitative comparisons across these distinct puddle types. Even within a small upland area, microbial communities varied widely—likely influenced by factors such as water clarity, vegetation, and organic input. The ability to visualize and analyze these differences from small, detritus-rich samples highlights FlowCam’s value for exploratory fieldwork and environmental monitoring in overlooked freshwater habitats. Equally important is the speed of the workflow: image collages and quantitative outputs are available immediately after the run, reducing analysis time from hours of microscopy to just minutes. For future samples, using higher-magnification objectives (e.g. 10X) will help capture finer detail while still retaining FlowCam’s broad size coverage. This flexibility makes it easy to tailor each analysis to the habitat and organisms of interest.
 Up Next: Exploring More Ecosystems with FlowCam
Future stops in the Planktoverse may feature anything from lake systems and roadside ditches to bloom events or coastal samples—depending on where fieldwork, travel, or curiosity takes us next. Whether the next installment comes from the English Lake District, a toxic cyanobacteria bloom, or a colleague’s sampling trip, the goal will remain the same: to explore new habitats and highlight different capabilities of FlowCam in real-world settings.
Before you go, check out my recent webinar that introduces FlowCam's operating principles and how it works as an important piece of the plankton analysis puzzle, including case studies from marine and freshwater environments:
WEBINAR | Flow Imaging Microscopy in the Plankton Analysis Toolbox