



Contributors: Leah Anne Gibala-Smith, Yokogawa Fluid Imaging Technologies; Mark Van Asten and Greg Ford, Phytoxigene; and and Lori Fields, Gold Standard Diagnostics
The 13th U.S. Symposium on Harmful Algae brought the HAB community together in Cedar Rapids, Iowa, to share research, technologies, and approaches for harmful algal bloom monitoring, management, forecasting, and mitigation. For the FlowCam team, the symposium was an opportunity to connect with researchers and water quality professionals working across these different areas of HAB science. We also hosted a lunch with FlowCam users, where we learned more about how researchers are using the instrument in their work, the applications they’re exploring, and the challenges they’re working to address.
In addition to exhibiting at the symposium, we co-hosted a hands-on workshop, “Algae and Cyanobacteria Blooms: Track, Identify, and Predict.” The workshop explored an integrated approach to HAB monitoring, following the process from the reservoir to the laboratory and demonstrating how different technologies can provide complementary information about bloom conditions.
Participants worked with three early-detection approaches: multi-parameter monitoring, flow imaging microscopy, and quantitative PCR (qPCR). Together, these tools illustrated how field observations, imaging, and molecular techniques can contribute different pieces of information when tracking and characterizing cyanobacteria blooms.
That collaborative, multi-method approach extended beyond the workshop. During the symposium, an environmental sample collected from nearby Cedar Lake gave us an opportunity to put complementary HAB analysis methods into practice on a single water sample.
From Cedar Lake to the Lab: Following One Bloom Sample
Dr. Tyler King of the United States Geological Survey (USGS) initiated the experiment by collecting the Cedar Lake sample and coordinating the participating teams: FlowCam, Phytoxigene, and Gold Standard Diagnostics. Rather than evaluating each analytical method in isolation, we followed the same environmental sample through light microscopy, flow imaging microscopy, quantitative PCR, and immunoassay-based test strips.
The result was a real-world demonstration of how complementary methods can build a more complete picture of a cyanobacterial harmful algal bloom.
Locating Algal Bloom Activity in Cedar Lake
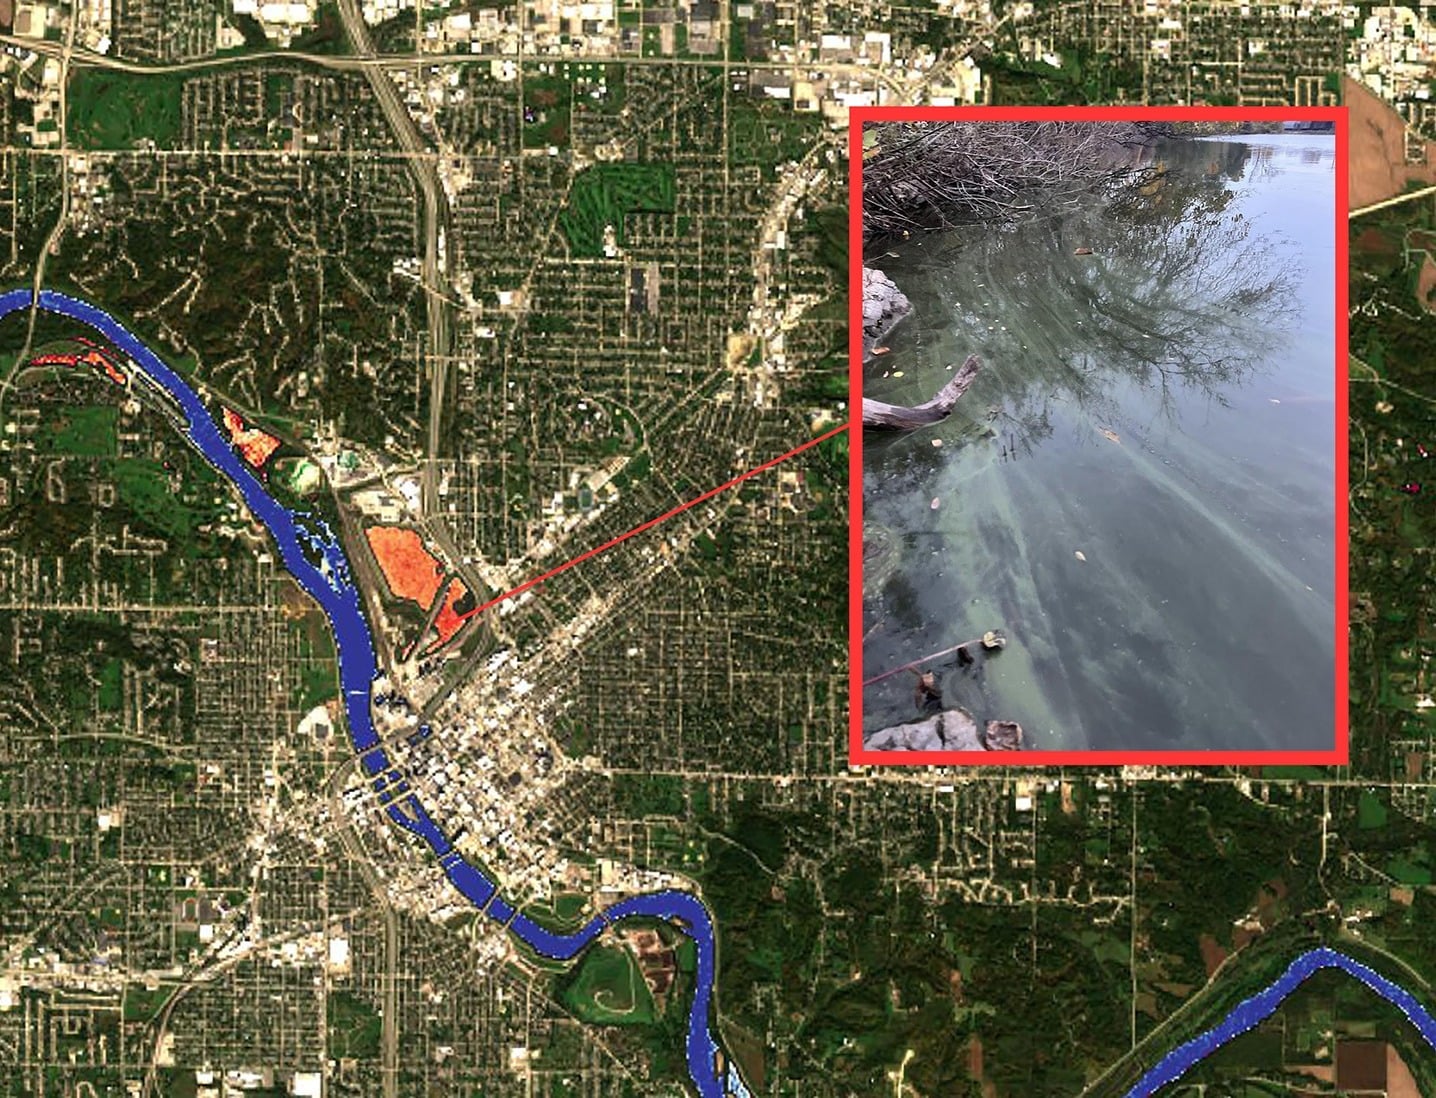
Tyler located the bloom using USGS WaterMAP (Water Monitoring Above the Planet), an interactive web application that displays satellite-derived water-quality observations alongside ground-based monitoring data.
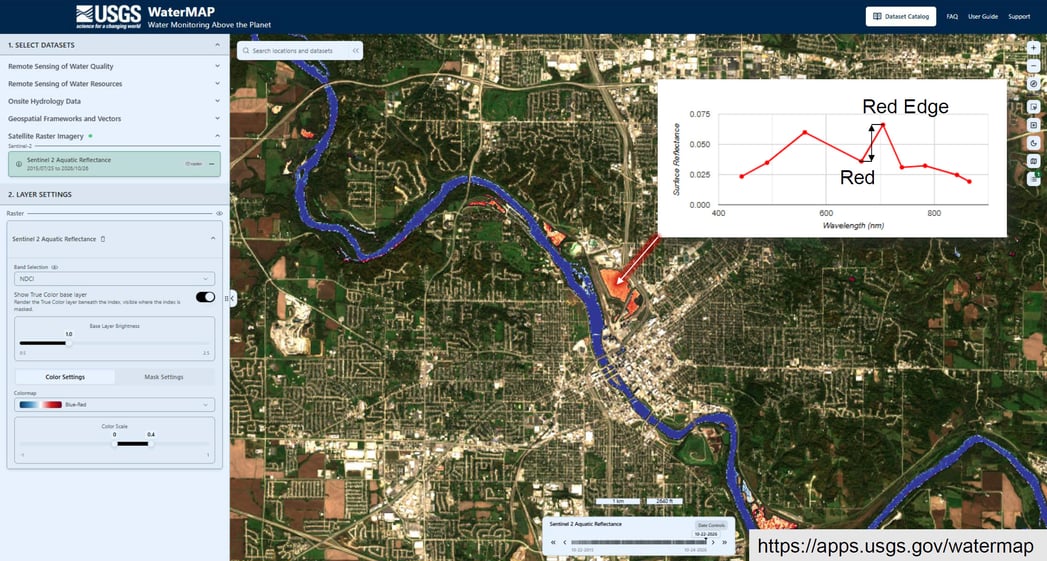
USGS WaterMAP map of Cedar Rapids, showing how areas of potential bloom activity are determined
Using the Sentinel-2 aquatic reflectance layer (shown above), he viewed the Normalized Difference Chlorophyll Index (NDCI) for Cedar Lake. Higher index values indicate higher chlorophyll concentrations and can help identify areas of potential bloom activity. This satellite view guided where to collect the sample before the water was brought to the symposium for further analysis.
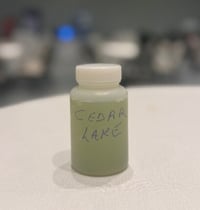 The collected sample was intensely green, indicative of a potential bloom. Before further analysis, Tyler examined it with an ioLight microscope and identified Planktothrix and Microcystis, two potentially toxigenic (PTOX) cyanobacterial taxa associated with harmful algal blooms.
This initial observation provided a presumptive identification of some of the dominant cyanobacteria, but additional analysis was needed to quantify the organisms present and assess their potential for toxin production.
Imaging and Classifying Cyanobacteria with Flow Imaging Microscopy
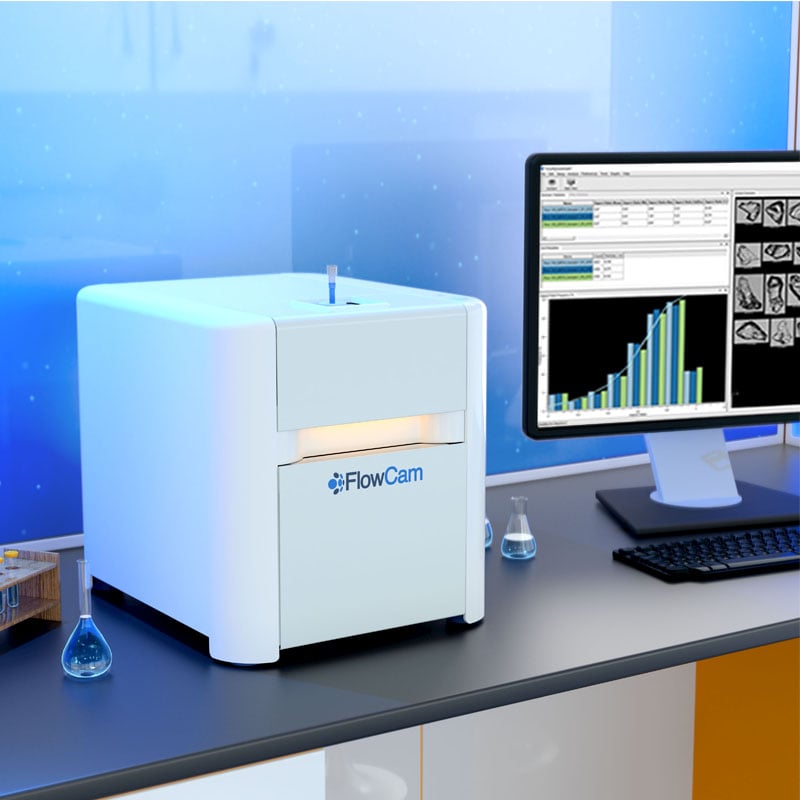
Tyler next brought the Cedar Lake sample to the FlowCam booth, where we analyzed it using flow imaging microscopy (FIM).
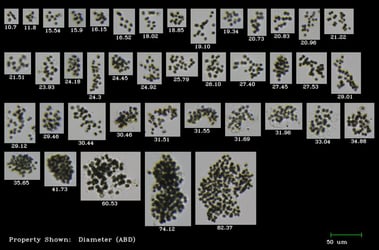
FlowCam captured digital images of particles as they passed through the flow cell, allowing us to count, measure, and classify the phytoplankton present in the sample. In addition to showing which taxa were present, FIM provided quantitative information about the composition of the bloom community, as shown below.
| Taxonomic Group | Taxon | Particles/mL |
|---|---|---|
| Cyanobacteria | Planktothrix |
116,876 |
| Dolichospermum compactum | 2,321 | |
| Dolichospermum | 39,867 | |
| Microcystis | 19,278 | |
| Pseudanabaena | 908 | |
| Aphanocapsa | 908 | |
| Green Algae | Desmodesmus | 1,413 |
| Diatoms | Aulacoseira | 707 |
| Other | Cryptomonad | 3,734 |
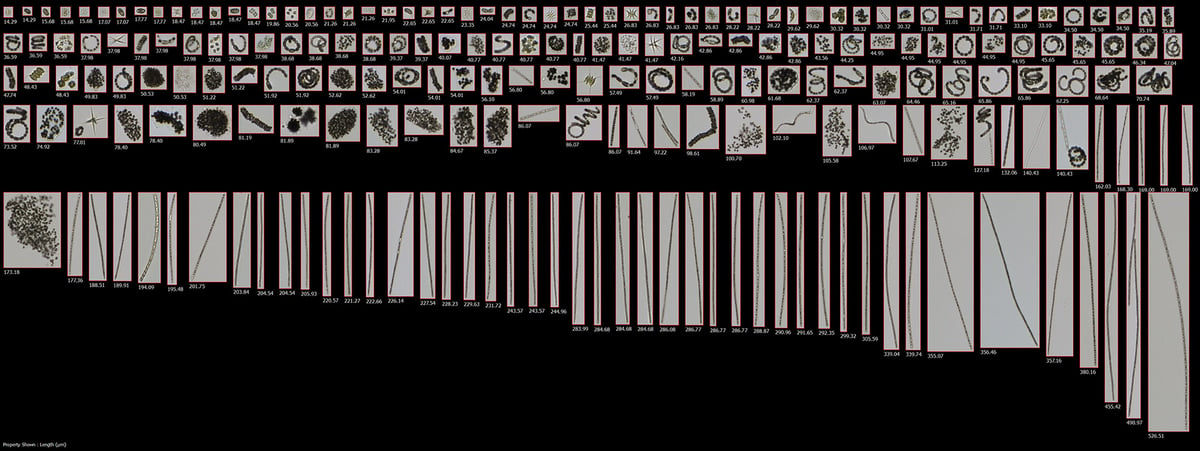 Representative images of taxa found in the Cedar Lake sample
FlowCam analysis indicated that approximately 97% of the classified assemblage consisted of cyanobacteria. Planktothrix was the most abundant potentially toxigenic cyanobacterium, at approximately 117,000 particles/mL. Dolichospermum spp. followed at approximately 42,200 particles/mL when the two classified groups are combined, while Microcystis was present at approximately 19,300 particles/mL.
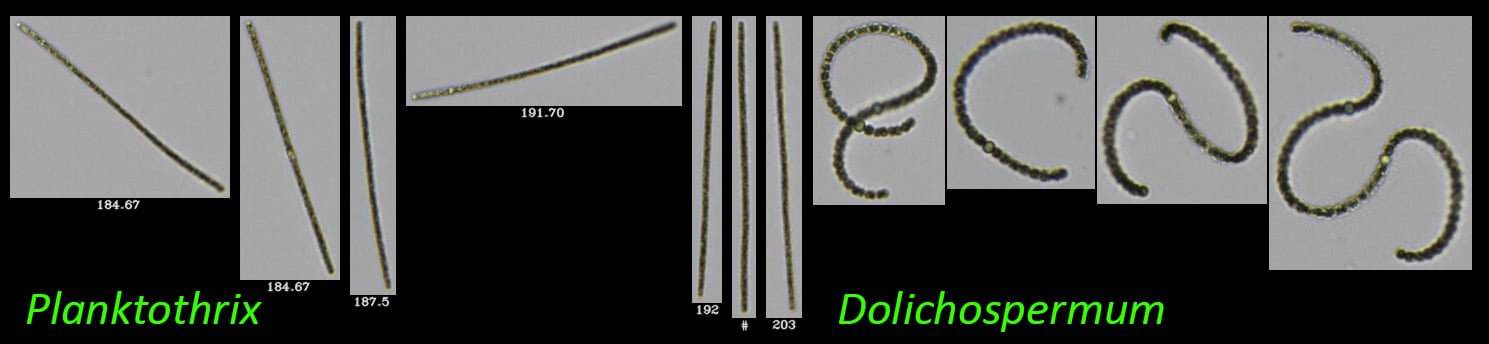
The non-PTOX cyanobacteria Pseudanabaena and Aphanocapsa were present in much lower numbers, along with the green algae Desmodesmus, the diatom Aulacoseira, and cryptomonads.
Together, the microscopy and FlowCam results showed a cyanobacteria-dominated phytoplankton community containing several taxa with the potential to produce cyanotoxins.
The next question was whether the sample contained genetic evidence associated with toxin production.
Assessing Toxigenic Potential of Cyanobacteria with qPCR
Phytoxigene analyzed the same Cedar Lake sample using quantitative PCR (qPCR).
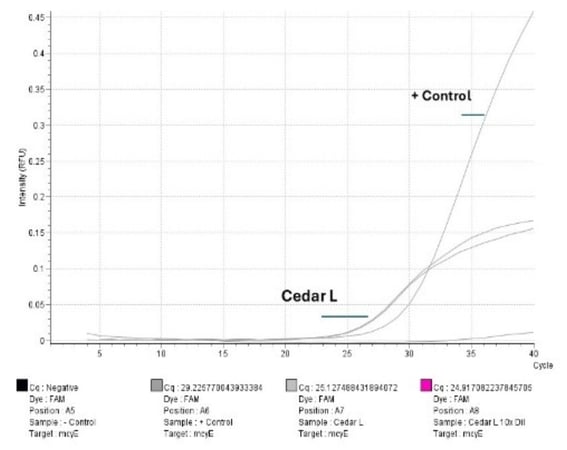
The assay quantified 19,000,000 copies of the cyanobacterial 16S rRNA gene, providing a molecular measure of total cyanobacteria. It also detected 132,000 copies of mcyE, a microcystin synthetase gene that serves as a marker of the genetic potential for microcystin production.
qPCR amplification profile of the mcyE gene (microcystin) for Cedar Lake:
Gene copy numbers for 16S rRNA (total cyanobacteria) and mcyE (microcystin) in Cedar Lake:
| Multi Sample Calculator, 16S | |||||
|---|---|---|---|---|---|
| Sample Name | Rxn Copy # | Filtered Volume | Dilution Factor | Copies per Sample | Copies per mL |
| Blank | 0 | 1 | 1 | - | - |
| Positive Control | 100,000 | 1 | 1 | 100,000 | 100,000 |
| Cedar L 10x DIL | 279,744 | 15 | 10 | 279,744,000 | 18,649,600 |
| Multi Sample Calculator, McyE | |||||
|---|---|---|---|---|---|
| Sample Name | Rxn Copy # | Filtered Volume | Dilution Factor | Copies per Sample | Copies per mL |
| Blank | 0 | 1 | 1 | - | - |
| Positive Control | 100 | 1 | 1 | 100,000 | 100,000 |
| Cedar L 10x DIL | 1,982 | 15 | 10 | 1,982,000 | 132.133 |
This analysis provided another piece of the bloom assessment. Whereas light microscopy and flow imaging microscopy characterized the organisms present, qPCR provided evidence that the cyanobacterial community contained genetic markers associated with the potential to produce microcystin.
However, identifying a toxin-production gene does not necessarily mean the toxin itself is present. For that, the team turned to a fourth analytical method.
Confirming Microcystin Results with ABRAXIS Test Strips
The Cedar Lake sample was then brought to the Gold Standard Diagnostics booth, where it was analyzed using ABRAXIS® Microcystins test strips.
The test strips indicated a total microcystins concentration greater than 10 ppb, providing evidence of microcystins in the sample.
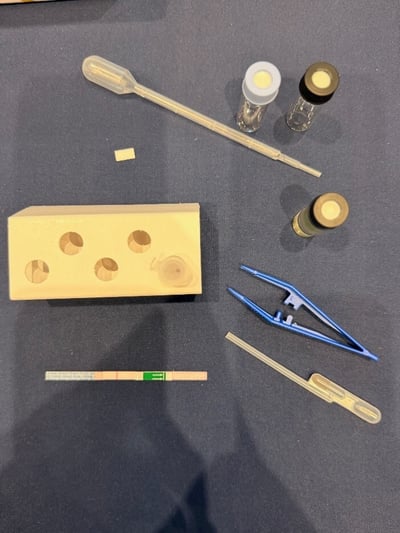
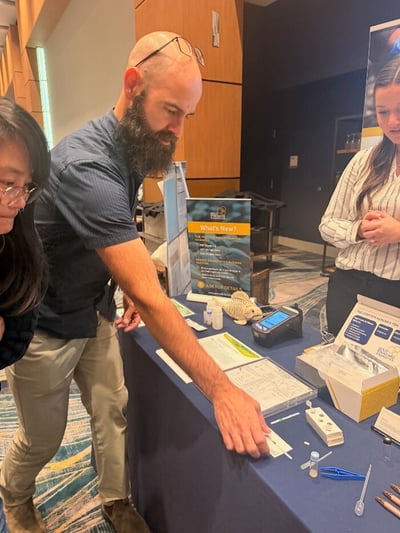
(Left) ABRAXIS test strips indicating high levels of microcystins in the Cedar Lake sample, (Right) Tyler King explains the test strip results.
This result added direct toxin detection to the developing picture of the bloom and was consistent with the other observations: microscopy identified potentially toxigenic cyanobacteria, FlowCam showed that these organisms were abundant within the phytoplankton community, and qPCR detected a genetic marker associated with microcystin-producing potential.
Four Complementary Methods for Harmful Algal Bloom Analysis
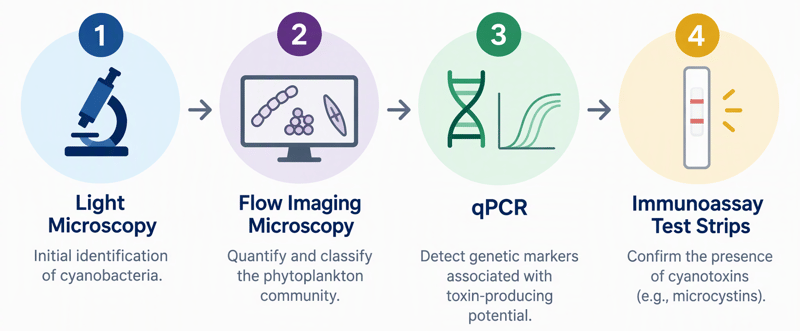
No single method told the entire story of the Cedar Lake bloom. Instead, each answered a different question:
-
Light microscopy: What cyanobacteria appear to be present?
-
Flow imaging microscopy: Which phytoplankton taxa are present, and at what densities?
-
qPCR: Does the cyanobacterial community contain genetic markers associated with toxin-producing potential?
-
Immunoassay test strips: Are microcystins detectable in the sample?
Together, these complementary methods connected bloom composition and abundance with toxigenic potential and toxin detection, providing a more complete picture of conditions in Cedar Lake than any single method could provide.
A Collaborative Approach to HAB Monitoring
What made the Cedar Lake analysis especially valuable was the opportunity to bring multiple technologies and areas of expertise together around the same environmental sample. The collaboration reflected the spirit of the 13th U.S. Symposium on Harmful Algae, where researchers, monitoring professionals, and technology providers came together to share approaches to a common challenge.
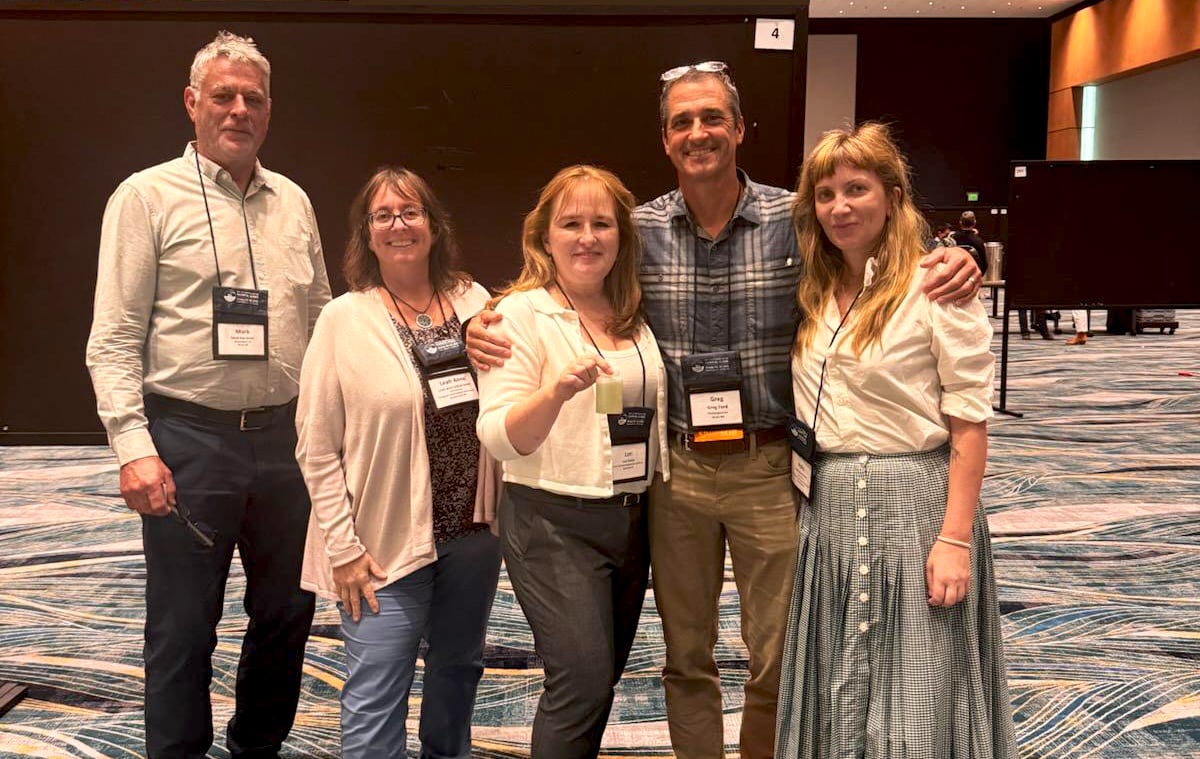 From left to right: Mark Van Asten, Leah Anne Gibala-Smith, Lori Fields, Greg Ford, Polly Barrowman
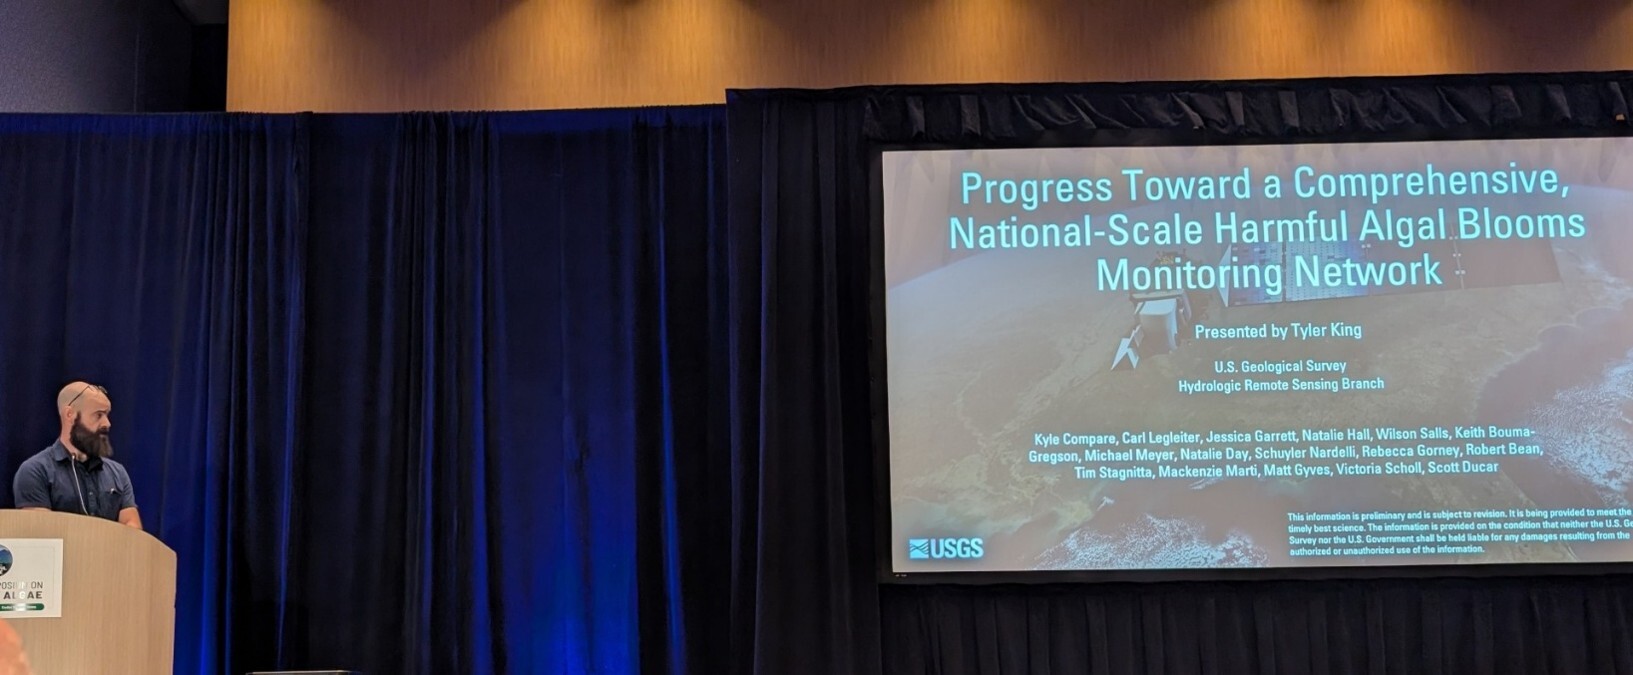 Tyler King presenting at the US HABs Conference in Cedar Rapids
The conversations around harmful algal bloom monitoring continue beyond the symposium. The FlowCam team will be at upcoming water-quality and aquatic science events throughout the year. See where you can meet the team on our upcoming events calendar.
Interested in how flow imaging microscopy can fit into a broader HAB monitoring strategy? Download our application note, “FlowCam for Harmful Algal Bloom Management in Drinking Water Utilities” to see how FIM can complement other monitoring methods and help inform more targeted responses to changing bloom conditions. Download the HAB monitoring application note: