



In the scientific community, a discovery only truly counts once it is shared, scrutinized, and understood by your peers. But simply broadcasting your results isn't enough; the true heartbeat of any impactful scientific paper lies in its methods section. Writing a clear, transparent, and complete methodology is not just a formatting chore, but an absolute ethical imperative. It bridges the gap between a standalone observation and a credible, reproducible breakthrough that the rest of the world can confidently build upon.
Transforming a complex, sometimes months-long experiment into a concise narrative can be easier said than done. The biggest hurdle researchers face is balancing thoroughness with the rigid word count constraints imposed by top-tier journals. When space is at a premium, deciding what makes the cut requires a strategic filter: you must prioritize information that directly impacts experimental replication and data interpretation. Ask yourself if a peer could buy the same materials, replicate your exact environmental variables, and arrive at the same data using your text. If certain details are not critical to the outcome, they can be relegated to the supplementary materials.
The balance between brevity and detail becomes especially critical when working with advanced, automated instrumentation like FlowCam, where minor omissions in technical reporting can drastically alter how data is interpreted and how downstream users can repeat the work. In a literature review of 166 peer-reviewed studies using FlowCam for phytoplankton analysis, Owen et al. (2022) found that reporting of FlowCam methods was consistently insufficient. The authors called for improved, standardized reporting to strengthen transparency and reproducibility across the scientific community.
In response to this call, below you’ll find an overview of key reporting areas, followed by a downloadable template to use when you start your next manuscript.
This resource was developed with plankton research in mind, but the themes and templates are applicable in other disciplines that publish with FlowCam, including biopharmaceutical research and materials science.
The Devil is in the Details: Key Reporting Areas that Shape Interpretability
Instrument
According to Owen et al., 53% of the 116 studies reviewed between 2017 and 2020 did not report which FlowCam model was used, let alone further details about the instrument's specifications that played a role in determining the outcome.
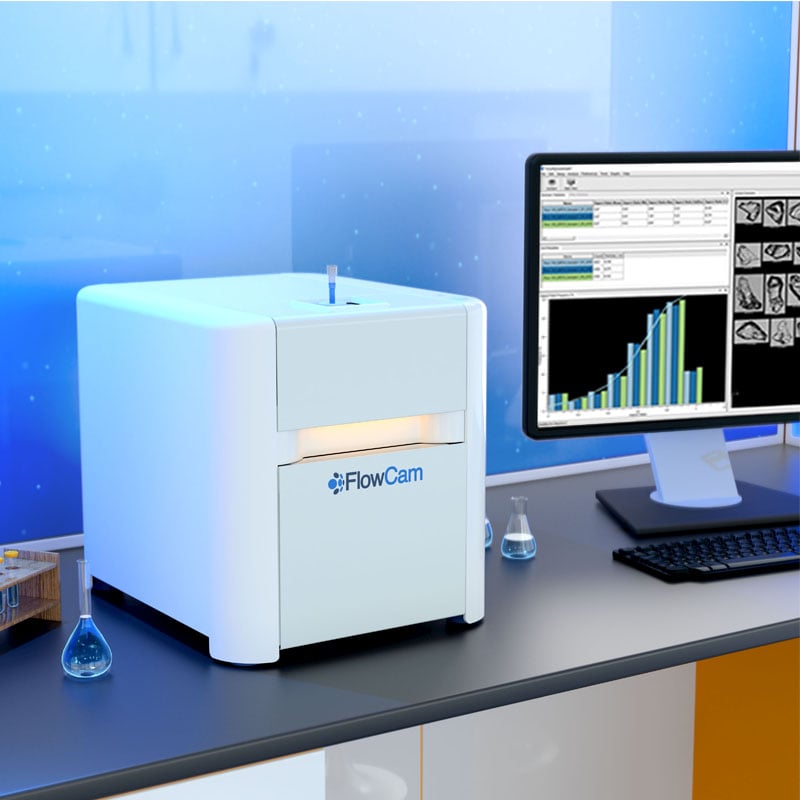
To a scientist who only used one FlowCam instrument in their study, saying “FlowCam” was used might feel sufficient. In reality, “FlowCam" could refer to one of many models with different capabilities, configurability options, and image outputs; some examples are shown below.
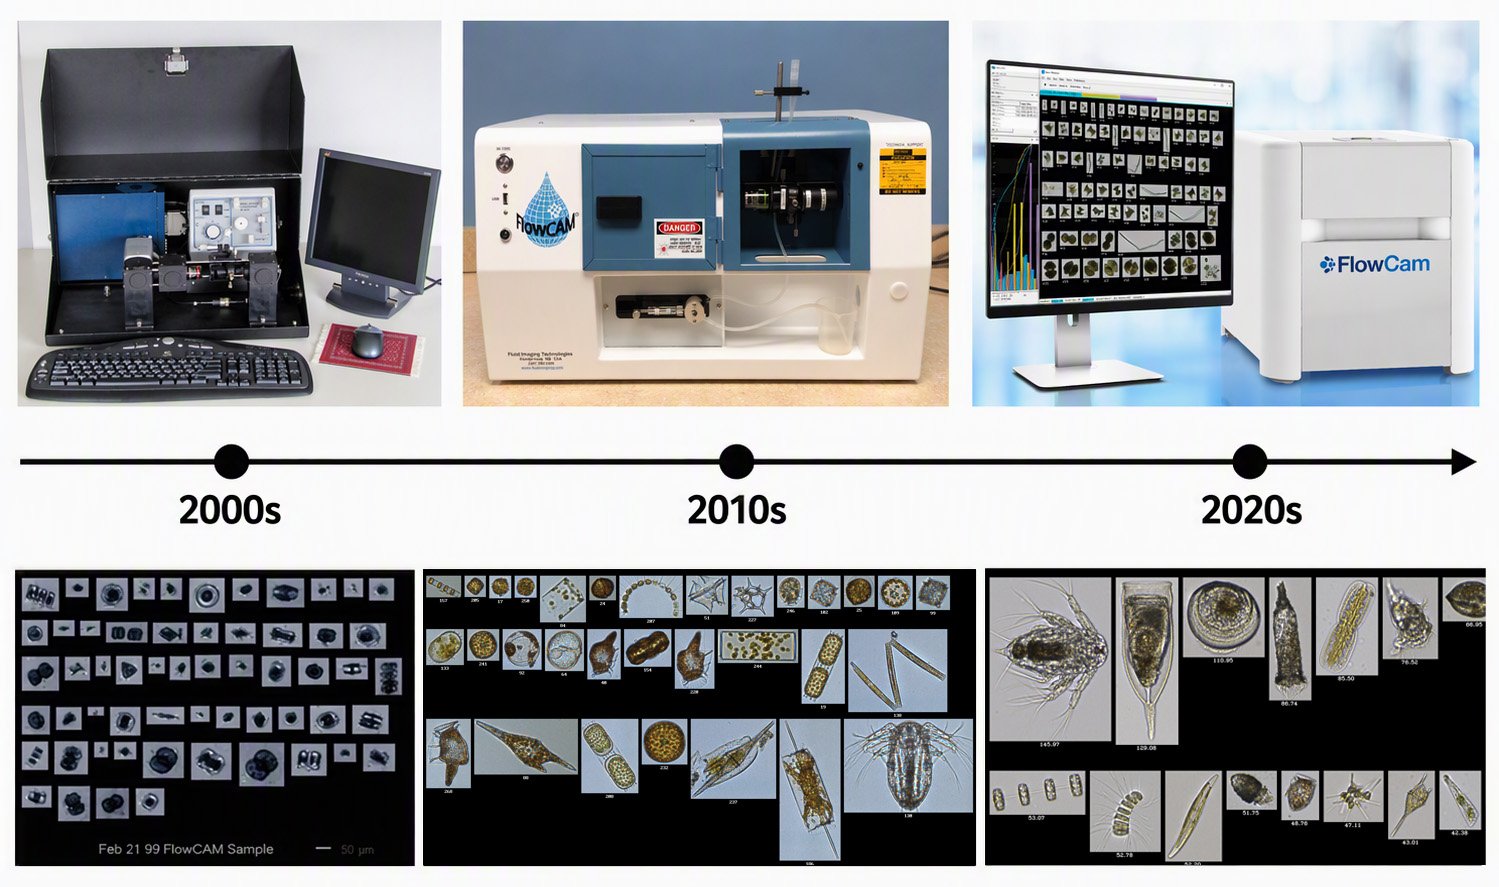
Instrument details like model name, configuration, and software version help define the boundaries of what’s achievable technologically in your study and help readers appreciate methodical choices downstream. Download the template below for recommendations of what details to include in the text of your manuscript.
Samples
Sample type and preparation both affect what is available for FlowCam to analyze; therefore, reporting what steps samples go through between collection and image acquisition is important for interpreting results. Preservation, dilution/concentration, and pre-filtration or size fractionation are particularly important, as these steps can influence particle size, color, and concentration.
Data Acquisition
After sample preparation, the hardware and software configurations used to image your samples are the next category required for complete reporting. Hardware components like the objective and flow cell have more obvious impacts on image acquisition, but the impact of software choices (especially mode of data acquisition and capture settings) may be less obvious, especially to new users.
To visualize the impact of different settings, check out our technical notes on file processing mode, background intensity, and capture settings.
Classification
Once you’ve described how you acquired your images, take readers into the workflow(s) you used to wrangle your data. Did you perform any pre- or post-processing steps to your images? Did you use any tools like EcoTaxa to classify images in addition to VisualSpreadsheet? Give readers enough information to appreciate how you got from images to insights.
Outputs
FlowCam provides dozens of particle properties to characterize particle images. This includes more than one way to measure things like diameter or length. If you’re using automated measurements, help readers understand which properties you chose to analyze and why they’re scientifically relevant for the questions your study is designed to answer.
Templates for Reporting FlowCam Methods
Given the impact that methodological choices have on results, Owen et al. highlighted the importance of templates to help users standardize reporting in scientific publications. Click the link below for a template you can adapt for your next manuscript, including tips to help clarify important terminology.
Summary: The Importance of Properly Citing FlowCam Models and Methods
With more context, it becomes easy to see how simply saying "FlowCam" was used isn’t enough to fully interpret or reproduce results. As is true for other instruments, the model and configuration used—not to mention sample preparation, data acquisition settings, and classification pipelines—can each affect outputs in different ways, underscoring the importance of efforts to standardize reporting in scientific literature.
References
Owen, B.M., Hallett, C.S., Cosgrove, J.J., Tweedley, J.R., Moheimani, N.R., 2022. Reporting of methods for automated devices: A systematic review and recommendation for studies using FlowCam for phytoplankton. Limnol. Oceanogr.: Methods 20, 472–499. https://doi.org/10.1002/lom3.10496